Introduction
Prometheus Blackbox Exporter is a popular plugin to test http endpoints. It offers a range of configuration options which can be tweaked to suit any use case. I recently had to implement monitoring for some APIs, each expecting a different content body.
Problem
By design, Prometheus blackbox exporter is not expected to work as a “proxy”, so you cannot pass the body of a request via relabelling in Prometheus configs.
Let’s say you want to monitor 2 APIs each of which expect you to provide a different payload. For this academic exercise, we can use https://httpbin.org/post as the API endpoint.
Solution
On a high level then, this needs 2 different steps -
- Add a new module in blackbox exporter configs
- Add a new job in prometheus config to use the module created under 1.
Step 1 - Blackbox Exporter
The blackbox.yaml configuration file with 2 new modules for each post request. Notice we also use the property fail_if_body_not_matches_regexp, which will fail our test if the response doesn’t have the text we expect.
 1modules:
 2  http_2xx:
 3    prober: http
 4    timeout: 5s
 5    http:
 6      valid_http_versions: ["HTTP/1.1", "HTTP/2.0"]
 7      valid_status_codes: []
 8      method: GET
 9      preferred_ip_protocol: "ip4"
10      ip_protocol_fallback: false
11  post_one_2xx:
12    prober: http
13    timeout: 5s
14    http:
15      valid_http_versions: ["HTTP/1.1", "HTTP/2.0"]
16      valid_status_codes: []
17      method: POST
18      headers:
19        content-type: application/json
20      body: '{"data": "one"}'
21      preferred_ip_protocol: "ip4"
22      ip_protocol_fallback: false
23      fail_if_body_not_matches_regexp: [".*one.*"]
24  post_two_2xx:
25    prober: http
26    timeout: 5s
27    http:
28      valid_http_versions: ["HTTP/1.1", "HTTP/2.0"]
29      valid_status_codes: []
30      method: POST
31      headers:
32        content-type: application/json
33      body: '{"data": "two"}'
34      preferred_ip_protocol: "ip4"
35      ip_protocol_fallback: false
36      fail_if_body_not_matches_regexp: [".*two.*"]
Let’s run a blackbox exporter container with the above config and see if this works.
1$ docker run --rm -d -p 9115:9115 --name blackbox_exporter -v `pwd`:/config prom/blackbox-exporter:master --config.file=/config/blackbox.yaml
Blackbox exporter should now be available on http://localhost:9115/. The endpoint of interest to us is http://localhost:9115/probe. Hit the probe endpoint either through curl or on the browser
1$ curl -s http://localhost:9115/probe?target=https://httpbin.org/post&module=post_one_2xx
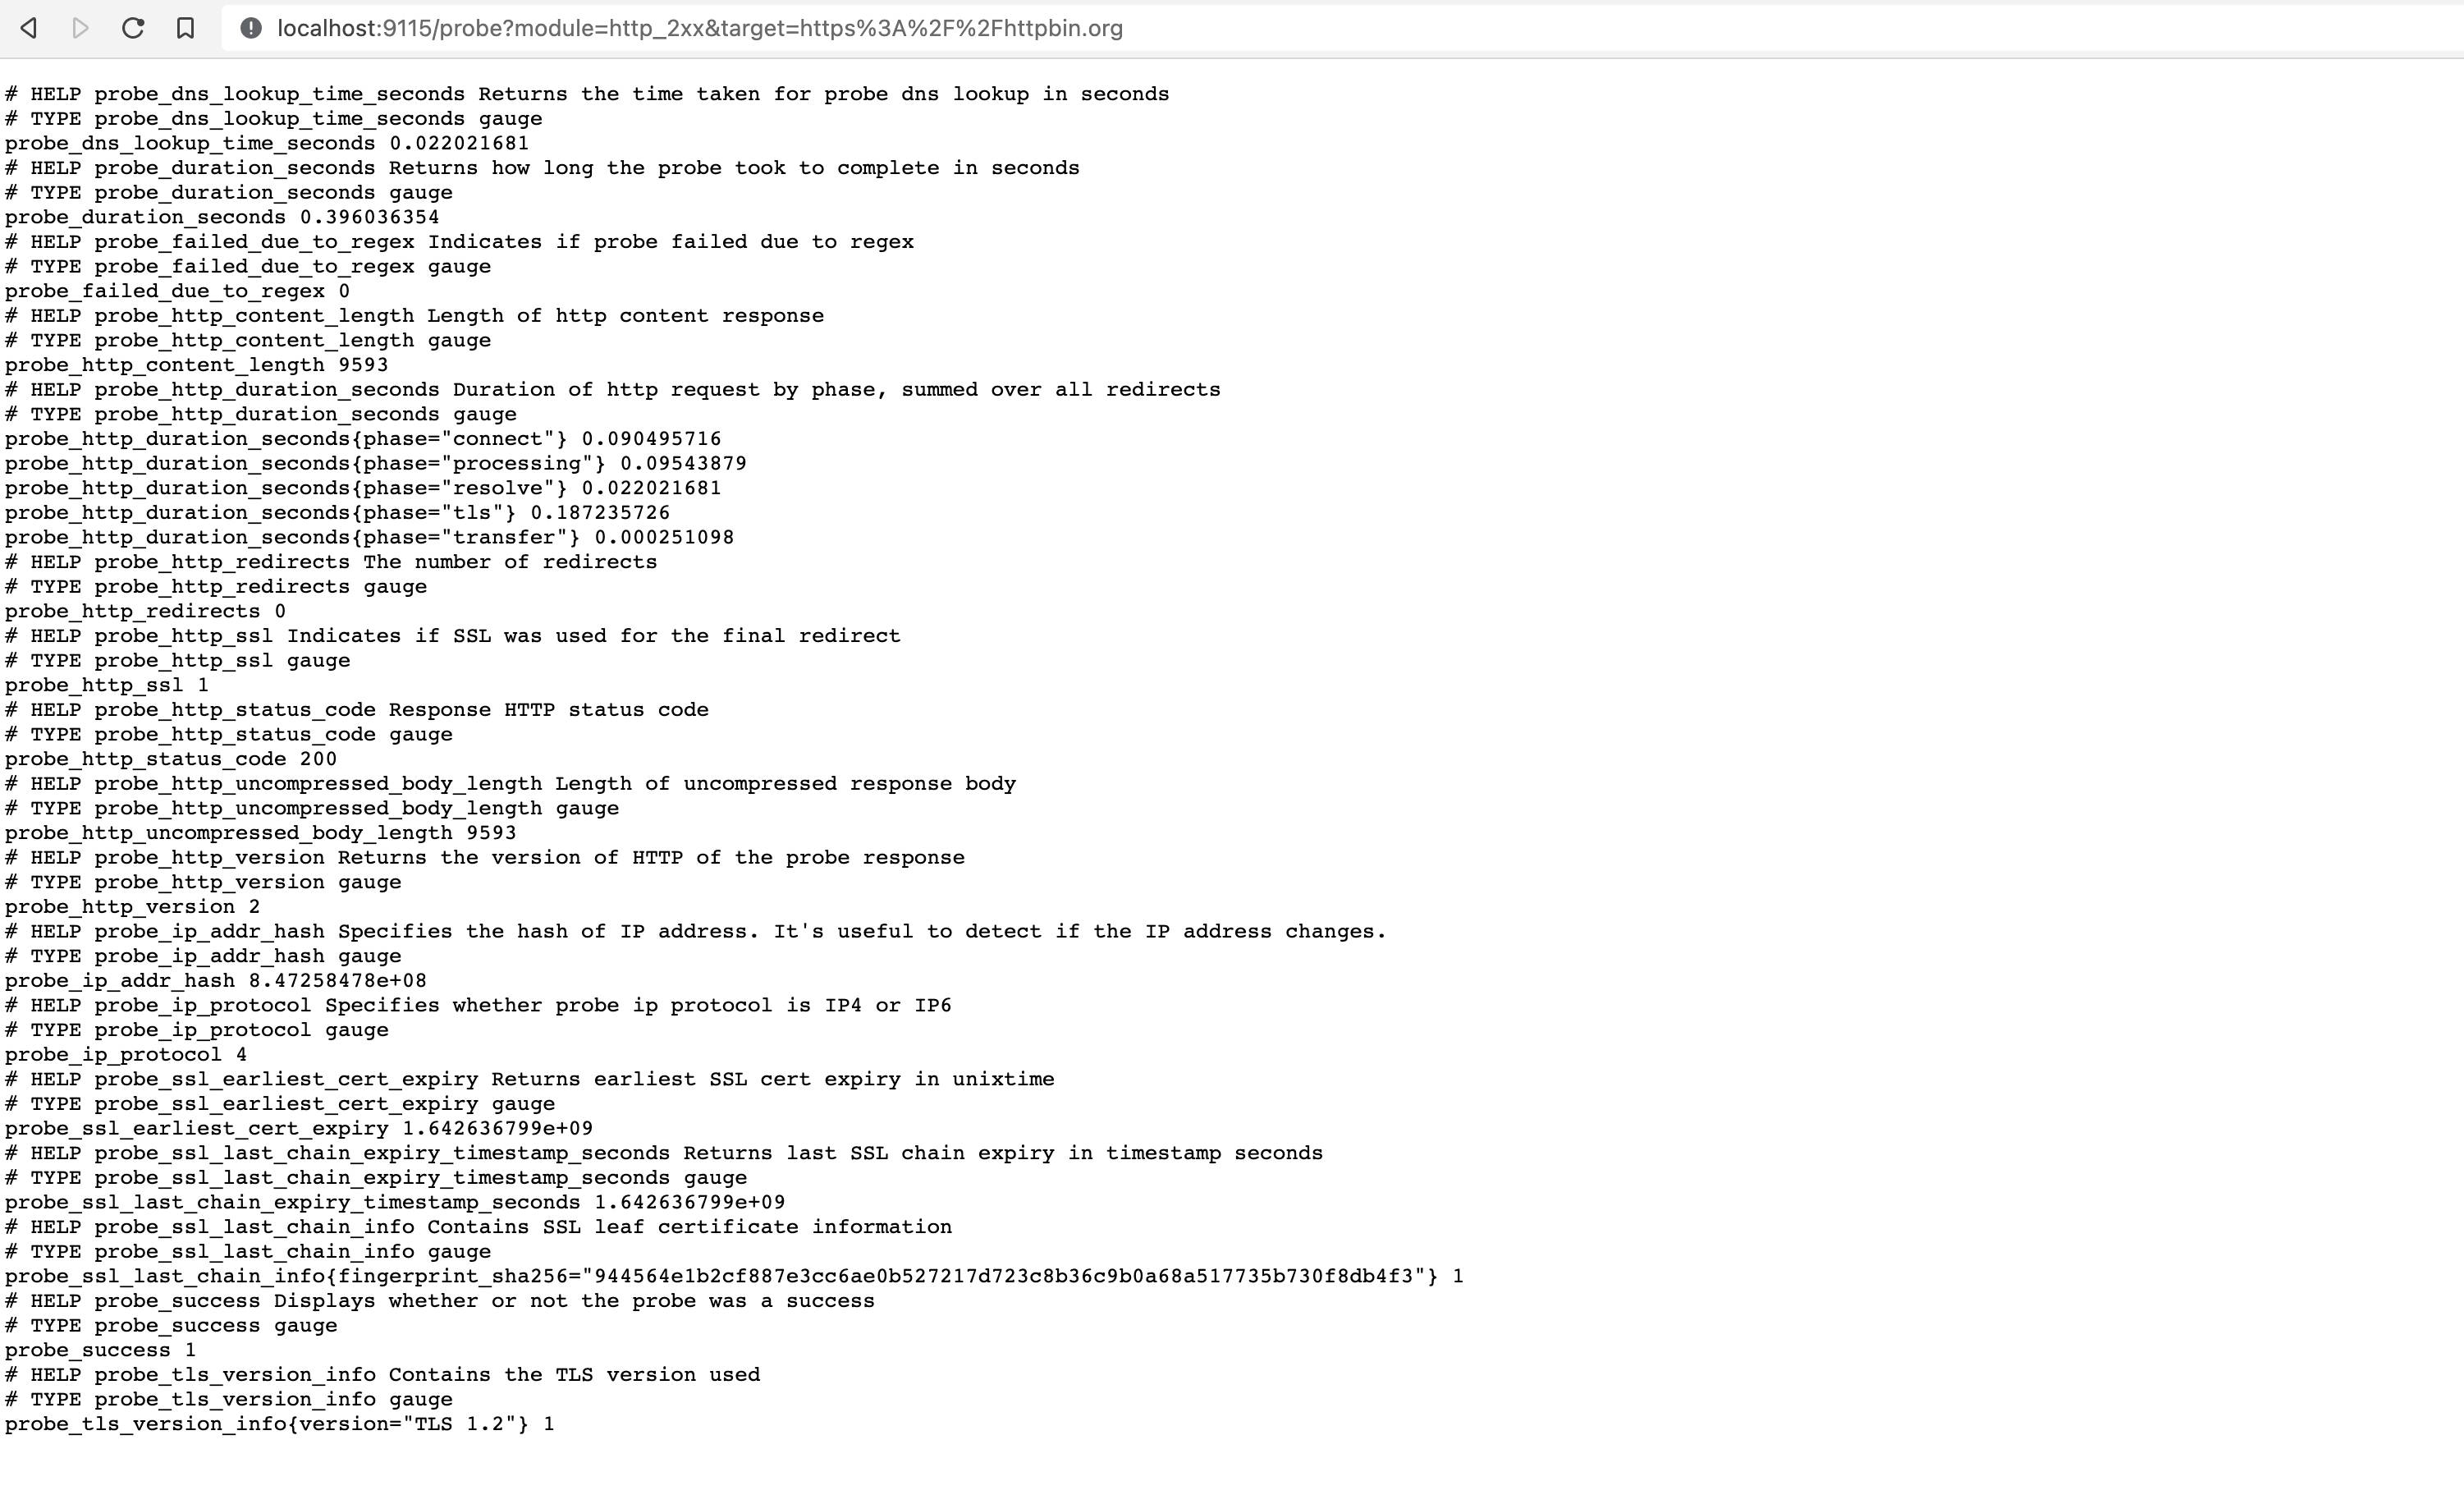
You should get a page with quite a few metrics listed. Look for the probe_failed_due_to_regex 0 and probe_http_status_code 200 metrics, and if they are there, it means our config worked! 👏
The probe hit https://httpbin.org/post with the data as defined in post_one_2xx module, AND matched the regex as defined under the module property fail_if_body_not_matches_regexp.
If you were to switch, or change the regex pattern, so that the response body would not match it, probe_failed_due_to_regex 1 will be returned instead.
Now that our blackbox exporter config is ready, let’s add the necessary config on Prometheus.
Step 2
The prometheus.yaml configuration file which points to the blackbox exporter we have running from Step 1.
 1global:
 2  scrape_interval: 1m
 3scrape_configs:
 4  - job_name: blackbox
 5    metrics_path: /metrics
 6    static_configs:
 7    - targets:
 8      - host.docker.internal:9115
 9  - job_name: blackbox-http
10    metrics_path: /probe
11    scrape_interval: 5m
12    params:
13      module: [http_2xx]
14    static_configs:
15      - targets:
16        - https://httpbin.org
17    relabel_configs:
18      - source_labels: [__address__]
19        target_label: __param_target
20      - source_labels: [__param_target]
21        target_label: instance
22      - target_label: __address__
23        replacement: host.docker.internal:9115
24  - job_name: blackbox-http-post-one
25    metrics_path: /probe
26    scrape_interval: 5m
27    params:
28      module: [post_one_2xx]
29    static_configs:
30      - targets:
31        - https://httpbin.org/post
32    relabel_configs:
33      - source_labels: [__address__]
34        target_label: __param_target
35      - source_labels: [__param_target]
36        target_label: instance
37      - target_label: __address__
38        replacement: host.docker.internal:9115
39  - job_name: blackbox-http-post-two
40    metrics_path: /probe
41    scrape_interval: 5m
42    params:
43      module: [post_two_2xx]
44    static_configs:
45      - targets:
46        - https://httpbin.org/post
47    relabel_configs:
48      - source_labels: [__address__]
49        target_label: __param_target
50      - source_labels: [__param_target]
51        target_label: instance
52      - target_label: __address__
53        replacement: host.docker.internal:9115
Let’s run a prometheus container with the above config and see all of this in action.
1$ docker run --rm -d -p 9090:9090 --name prometheus -v `pwd`:/config prom/prometheus:latest --config.file=/config/prometheus.yaml
Prometheus should now be available on http://localhost:9090/. Navigate to the targets page, to see it has picked up our blackbox exporter targets.
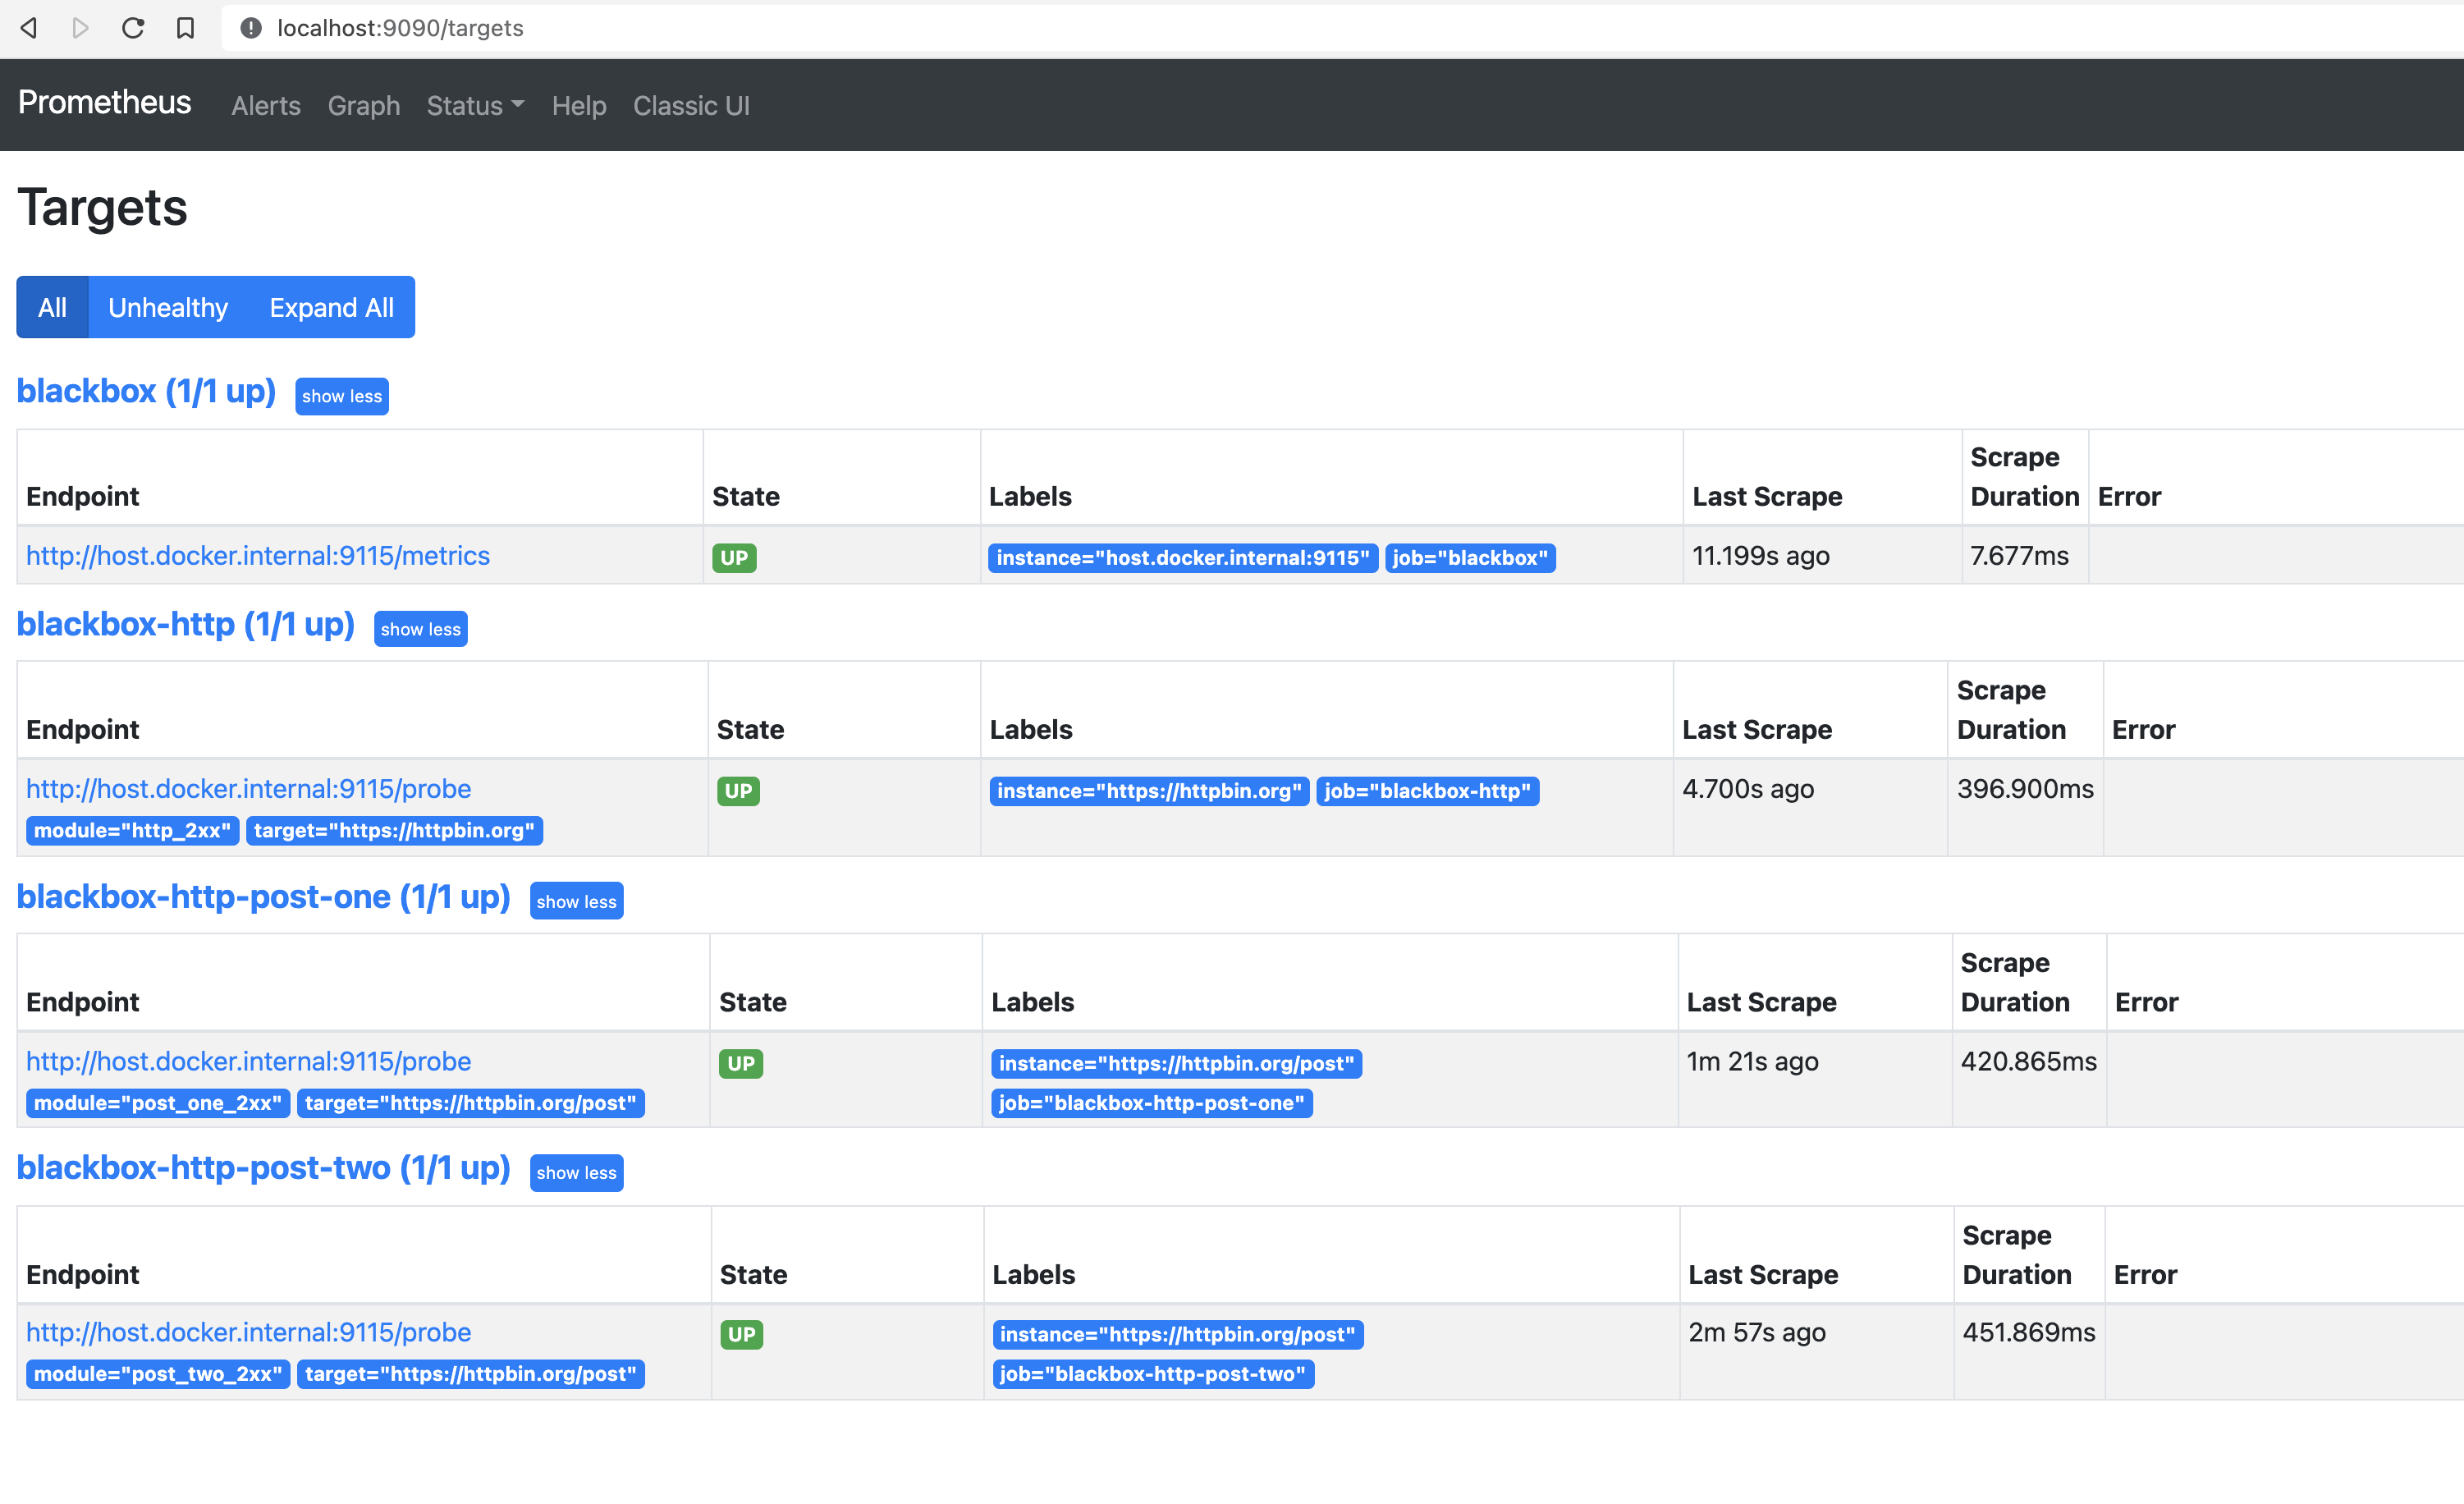
Once you have this integration going and Prometheus is scraping the Blackbox exporter, it is quite trivial to add more endpoints. Except ofcourse, when you want to monitor another API POST call. In that case, you need to start at step 1 again. Groundhog Day, eh? 🙃
Conclusion
That’s it!
This was a short post about using Prometheus Blackbox exporter to monitor different APIs.
Hope this post proves useful. 👍