Introduction
Elasticsearch is an open-source search solution which is quite popular for centralzed logs ingestion. It allows logs from various different sources to be available and searchable at a centralized location.
Ingesting data from various sources though, creates a problem. How do you normalize the incoming data, split it into some common fields, add or remove metadata etc? To perform all of this (and more), Logstash is the go-to solution. It can manipulate, transform incoming data before pushing it off to Elasticsearch for indexing.
Kibana is the tool of choice to search and visualize data indexed in Elasticsearch. These 3 together, are often referred as the ELK stack.
Problem
AWS now has a managed Elasticsearch offering which is a fantastic option for small teams with limited capacity to manage a self hosted Elasticsearch solution on EC2/ECS/EKS. There is a downside though. It only offers E_K from the ELK stack. Yes, there is no L (Logstash) out of the box. The only option is to self host a Logstash install - which kind of defeats the purpose of using a managed service.
Solution
Enter Elasticsearch ingest pipelines. These are not a complete replacement of Logstash, but they can do the data transformation part quite easily, if that’s the only thing you use Logstash for. Best part being, they run on the same cluster as Elasticsearch.
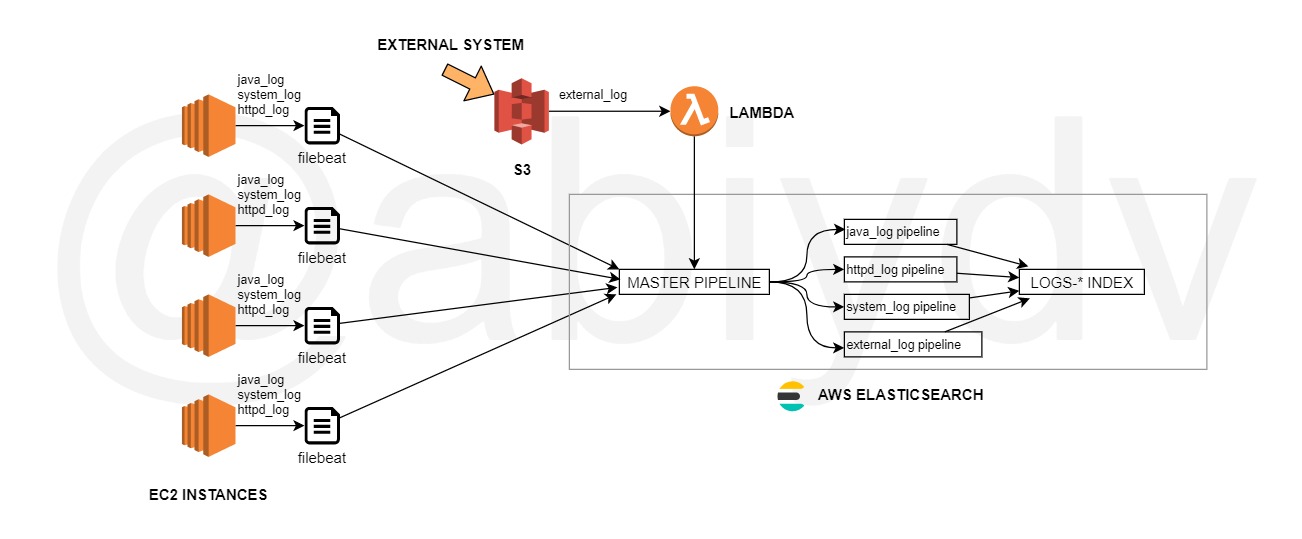
In my project, logs are being aggregated from a number of different sources - java app logs, httpd logs, systemd logs, external system logs etc. While most of these are ingested using filebeat agents, external logs arriving in S3 are ingested via Lambda.
Using ingest pipelines, I can split the data in various fields by applying different grok patterns but indexing them back in the same index. At a high level, this is what the whole setup looks like.
Ingest Pipeline(s)
At its core, an ingest pipeline is a series of processors that are executed in order, to process/transform data. In this case, there are multiple ingest pipelines. The main pipeline accepts all incoming data, and based on some condition, will then invoke the sub-pipelines.
The some condition here is the value of the field logpattern. This will become more clear as we look at the configuration of each component in this whole setup.
Let’s start with creating the pipelines first. Then we’ll look at the entrypoints - filebeat and lambda - which read the logs and forward it to the Elasticsearch cluster.
Main Pipeline Configuration
Broadly, all pipelines have the same structure - description and a bunch of processors. In the case of master_pipeline, I have used the following -
drop- To prevent the document from getting indexed on some condition.set- To add a new field, value can either be static or derived from other fields.remove- To delete a field from the document before it is indexed.pipeline- Trigger other ingest pipelines for further steps.
 1{
 2    "description" : "main pipeline",
 3    "processors" : [
 4      {
 5        "drop" : {
 6          "if" : "ctx.message.toLowerCase().contains('some unwanted data')"
 7        }
 8      },
 9      {
10        "set" : {
11          "field" : "hostname",
12          "value" : "{{host.name}}"
13        }
14      },
15      {
16        "remove" : {
17          "field" : [
18            "host.containerized",
19            "host.architecture",
20            "host.hostname",
21            "host.name",
22            "host.os.codename",
23          ]
24        }
25      },
26      {
27        "pipeline" : {
28          "if" : "ctx.logpattern == 'java_log'",
29          "name" : "java_log_pipeline"
30        }
31      },
32      {
33        "pipeline" : {
34          "if" : "ctx.logpattern == 'httpd_log'",
35          "name" : "httpd_log_pipeline"
36        }
37      },
38      {
39        "pipeline" : {
40          "if" : "ctx.logpattern == 'system_log'",
41          "name" : "system_log_pipeline"
42        }
43      }
44      {
45        "pipeline" : {
46          "if" : "ctx.logpattern == 'external_log'",
47          "name" : "external_log_pipeline"
48        }
49      }
50    ],
51    "on_failure" : [
52      {
53        "set" : {
54          "field" : "Error",
55          "value" : "{{_ingest.on_failure_message}}"
56        }
57      }
58    ]
59  }
Other pipelines also have the same structure, but different processors. The most important one being the grok processor. It is responsible for splitting the log entry into sub-fields which can then be searched or aggregated. Following is an example for the httpd_logs_pipeline.
 1{
 2    "description" : "httpd logs",
 3    "processors" : [
 4      {
 5        "gsub" : {
 6          "field" : "message",
 7          "pattern" : "\"",
 8          "replacement" : ""
 9        }
10      },
11      {
12        "grok" : {
13          "field" : "message",
14          "patterns" : [
15            "^%{IPV4:ipv4} - %{USER:username} %{HTTPDATE:datetime} %{PROG:method} %{URIPATHPARAM:request_uri} %{EMAILLOCALPART:http_version} %{NUMBER:http_status_code} %{PROG:pid} (%{NOTSPACE:request_by}|-) %{JAVALOGMESSAGE:useragent}$"
16          ]
17        }
18      },
19      {
20        "set" : {
21          "field" : "details",
22          "value" : "{{ipv4}} - {{username}} {{method}} {{request_uri}} {{http_version}} {{http_status_code}} {{pid}} {{request_by}} {{useragent}}"
23        }
24      },
25      {
26        "date" : {
27          "field" : "datetime",
28          "formats" : [
29            "dd/MMM/yyyy:HH:mm:ss Z",
30            "ISO8601"
31          ],
32          "timezone" : "Europe/London"
33        }
34      },
35      {
36        "uppercase" : {
37          "field" : "severity",
38          "on_failure" : [
39            {
40              "set" : {
41                "field" : "severity",
42                "value" : "INFO"
43              }
44            }
45          ]
46        }
47      },
48      {
49        "remove" : {
50          "field" : "datetime"
51        }
52      }
53    ]
54}
Elasticsearch Configuration
Once ingest pipeline jsons are ready, it’s quite simple to add these to the Elasticsearch cluster. Following command adds a new pipeline
1$ curl -X POST https://elasticsearch.example.com/_ingest/pipeline/pipeline_name -d pipeline_definition.json
Following command diplays currently configured pipelines on the Elasticsearch cluster.
1$ curl https://elasticsearch.example.com/_ingest/pipeline
Filebeat Configuration
The source of logs are modified next to use the configured ingest pipelines.
Shown here are only a subset of all the propeties that might be required. Notice the field logpattern under fields - this ensures the new field is appended to every log entry. Further down, in the Elasticsearch section, index name and the pipeline name are specified.
 1- type: log
 2  enabled: true
 3  paths:
 4    - /opt/app/server/logs/stdout.log
 5  fields_under_root: true
 6  fields:
 7    logpattern: "java_logs"
 8    role: "java"
 9  multiline.pattern: ^\d{4}-\d{1,2}-\d{1,2}
10  multiline.negate: true
11  multiline.match: after
12# Elasticsearch
13output.elasticsearch:
14  hosts: [ "https://elasticsearch.example.com:443" ]
15  index: "logs-%{+yyyy.MM.dd}"
16  pipeline: main_pipeline
Lambda Configuration
Second input source is Lambda, which uses the Elasticsearch bulk API to index the logs pushed to S3. In this case, similar to filebeat, a new field logpattern is added to each record. After that, during indexing, a new querystring with the pipeline name is added.
POST /index/_bulk?pipeline=master_pipeline
Conclusion
That’s it!
Now all incoming data gets transformed first by a combnation of ingest pipelines, before getting indexed in Elasticsearch. 👏